Visualizing how a Bitcoin transaction works

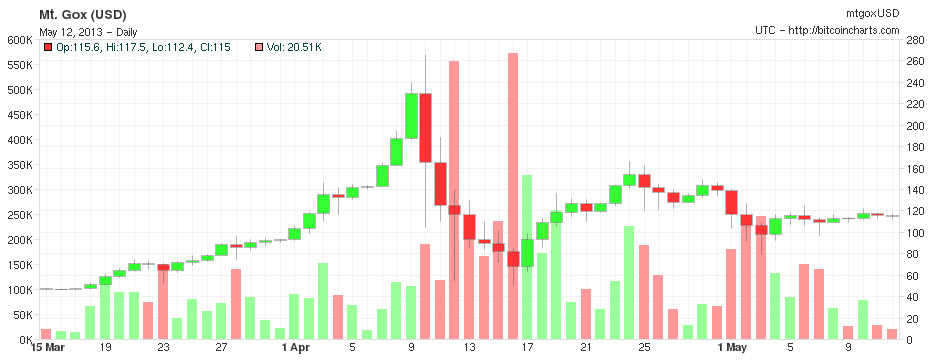
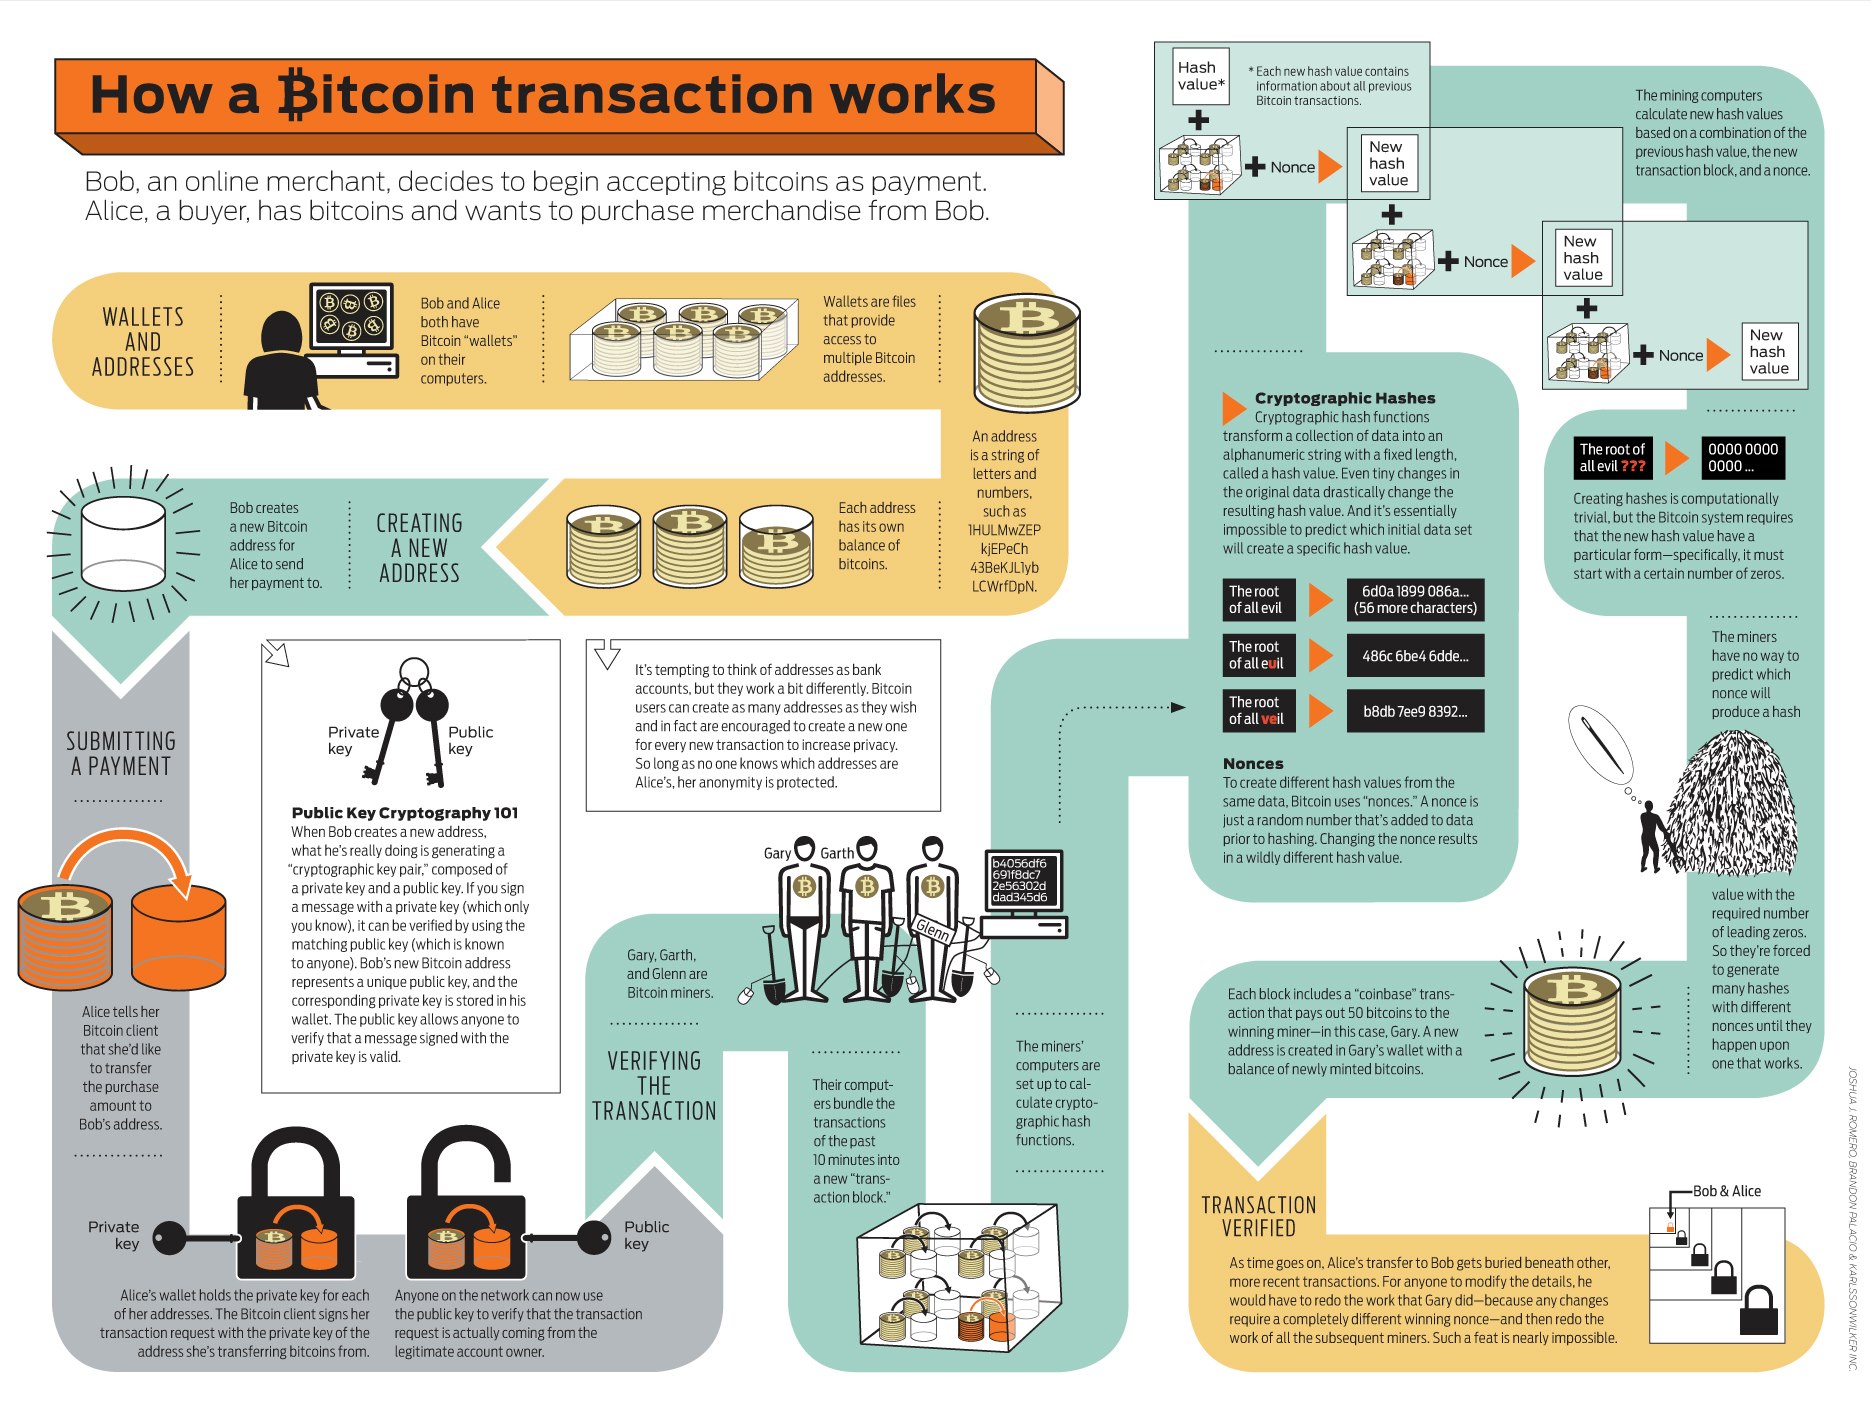
Following the last primer on the digital currency, prices have somewhat stabilized (despite the ongoing efforts of TPTB to regulate it out of existence). The following infographic provides a step-by-step illustration of how a bitcoin transaction occurs.

bitcoinchart

901053_10151477703598432_560990648_o

(h/t Dr. Constantin Gurdgiev via True Economics blog)

One thought

Leave a Reply

Fill in your details below or click an icon to log in:

WordPress.com Logo

You are commenting using your WordPress.com account. Log Out /  Change )

Facebook photo

You are commenting using your Facebook account. Log Out /  Change )

Connecting to %s